


Archiu:Maisières.png
Tamany d'esta vista prèvia: 401 × 599 píxels. Atres/s resolucions: 160 × 240 píxels | 522 × 780 píxels.


Resolució completa. ((522 × 780 pixels, tamany de l'archiu: 23 kB, MIME tipo: image/png))

Summary
| Description |
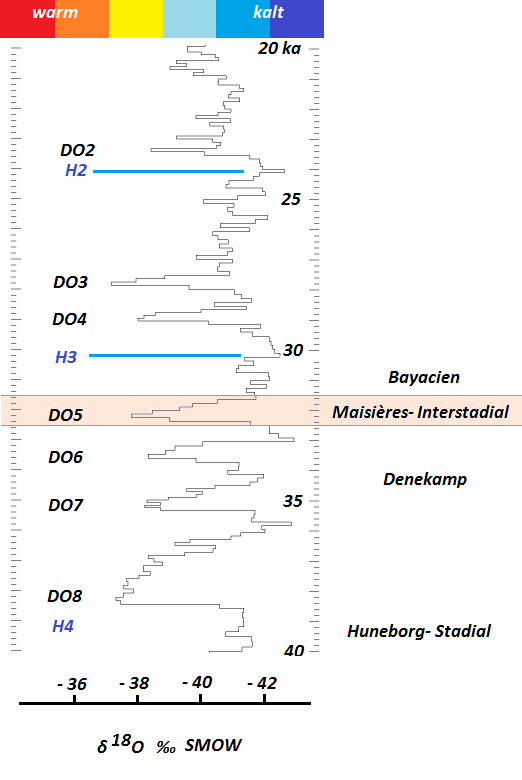
English: Diagram showing the position of the Maisières interstadial (marked in red) within the time range 20 to 40 ky BP. The δ18O values from GISP-2 follow the diagram of Wolfgang Weißmüller. The positions of the Dansgaard-Oeshger events DO2 to DO8 and the Heinrich events H2 to H4 are also indicated.
Deutsch: Das Maisières-Interstadial (markiert in rot) im Zeitraum 20 bis 40 ka BP. Der Verlauf der δ18O-Werte des GISP-2 Eisbohrkerns folgt dem Kurvenverlauf von Wolfgang Weißmüller. Ebenfalls markiert sind die DO-Ereignisse DO2 bis DO8 und die Heinrich-Ereignisse H2 bis H4. |
| Date | |
| Source | Own work |
| Author | Rudolf Pohl |
Licensing
I, the copyright holder of this work, hereby publish it under the following license:


This file is licensed under the Creative Commons Attribution-Share Alike 3.0 Unported license.
- You are free:
- to share – to copy, distribute and transmit the work
- to remix – to adapt the work
- Under the following conditions:
- attribution – You must give appropriate credit, provide a link to the license, and indicate if changes were made. You may do so in any reasonable manner, but not in any way that suggests the licensor endorses you or your use.
- share alike – If you remix, transform, or build upon the material, you must distribute your contributions under the same or compatible license as the original.
Historial de l'image
Puncha en la data/hora per a vore l'image tal i com es mostrava en eixe moment.
| Data/Hora | Miniatura | Dimensions | Usuari | Descripció | |
|---|---|---|---|---|---|
| actual | 23:07 20 maig 2013 | | 522 × 780 (23 kB) | wikimediacommons>Rudolf Pohl | {{Information |Description ={{en|1=Diagram showing the position of the Maisières interstadial (marked in red) within the time range 20 to 40 ky BP. The δ18O values from GISP-2 follow the diagram of Wolfgang Weißmüller. The positions of the Dansg... |
Enllaços a l'image
Les següents pàgines enllacen ad esta image:
