


Archiu:1994- Global average temperature during June-July-August.svg
Tamany d'esta previsualisació PNG de l'archiu SVG: 800 × 600 píxels. Atres/s resolucions: 320 × 240 píxels | 640 × 480 píxels | 1024 × 768 píxels | 1280 × 960 píxels | 2560 × 1920 píxels | 1000 × 750 píxels.
Resolució completa. ((Image SVG, nominalment 1000 × 750 pixels, tamany d'archiu: 2 kB))
Summary
| Description |
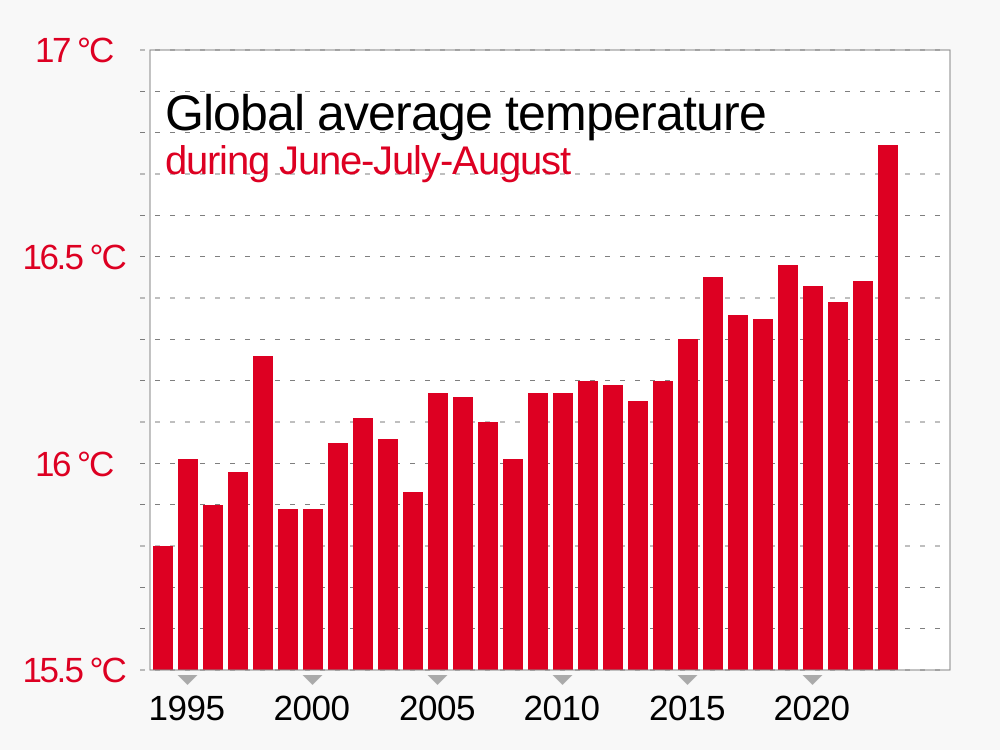
English: Chart showing global average surface temperature during the months of June, July, August ("boreal summer")
|
||
| Date | |||
| Source | Own work | ||
| Author | RCraig09 |


Licensing
I, the copyright holder of this work, hereby publish it under the following license:


This file is licensed under the Creative Commons Attribution-Share Alike 4.0 International license.
- You are free:
- to share – to copy, distribute and transmit the work
- to remix – to adapt the work
- Under the following conditions:
- attribution – You must give appropriate credit, provide a link to the license, and indicate if changes were made. You may do so in any reasonable manner, but not in any way that suggests the licensor endorses you or your use.
- share alike – If you remix, transform, or build upon the material, you must distribute your contributions under the same or compatible license as the original.
Historial de l'image
Puncha en la data/hora per a vore l'image tal i com es mostrava en eixe moment.
| Data/Hora | Miniatura | Dimensions | Usuari | Descripció | |
|---|---|---|---|---|---|
| actual | 17:07 12 set 2023 | | 1000 × 750 (2 kB) | wikimediacommons>RCraig09 | Version 2: change vertical scale to more closely match that chosen by source |
Enllaços a l'image
Les següents pàgines enllacen ad esta image:
